Review of IDL
4 Presentation
4.1 Image Display
Images are displayed in a separate graphical window (the default graphical device, see Data Output), and multiple images can be displayed within a single window. Graphics may be generated using Direct Graphics or Object Graphics routines.
Direct Graphics routines draw their output directly onto the current graphics device, when a new item is added to a plot, it is drawn in front of the existing items. A large number of direct standard plot routines are provided. For all these routines axis scaling and range, titles, annotations, plot symbols, font, etc, can all be modified.
Object Graphics is an object-oriented engine with a class library of graphics objects that can be used by programmers to develop their own graphical applications within IDL. Those wishing to use Object Graphics should already be familiar with object-oriented programming. Object Graphics have not been covered in this review.
The PLOT routine provides a simple linear-linear plot of a vector or pair of vectors. Log-linear and log-log plots are also available. Multiple plots can be put on the same axes using OPLOT (overplot). More plotting facilities are available using INSIGHT (see below).
Two-dimensional arrays can be represented as contours, surfaces or images. The CONTOUR procedure draws contour lines either cell by cell or following individual contour lines. The resulting plot can be superimposed on another image. The contours may also be filled with solid or line-filled polygons. The SURFACE procedure draws a wire mesh equivalent of the contours, with a specified degree of rotation about the axes.
Similar to the SURFACE routine, SHADE_SURF produces a shaded surface. Shading can either be constant or using Gouraud interpolation, and light source shading is achieved using a method similar to that of Foley and Van Dam.
Gridding
Most of IDL's plotting routines require uniformly spaced data. To handle irregularly spaced data, the TRIANGULATE procedure constructs a Delaunay triangulation of a planar set of points. The TRIGRID function is then used to interpolate the values to a regular grid, using linear or smooth quintic polynomial interpolation. These routines can also be used to perform gridding and interpolation over the surface of a sphere.
Volume Visualization
Creating an isosurface from a three-dimensional data grid can be achieved using the SHADE_VOLUME and POLYSHADE routines. SHADE_VOLUME outputs a set of polygons that describe the surface, which are then fed to the POLYSHADE routine to produce a shaded surface. The keyword T3D instructs the procedure to use the 3-D to 2-D transformational matrix stored in the system variable !P.T. By altering the value of this matrix the shaded volume can be viewed from different angles, and so simple animations can be created. It should be noted that these procedures are very memory dependent.
Volumetric data can be visualised using the VOXEL_PROJ or PROJECT_VOL procedures. These are similar routines which generate a 2-D projection of a coloured, semi-transparent volume. Colour can be assigned to arbitrary data ranges, for example where different types of tissue in a medical sample need to be highlighted. In VOXEL_PROJ parallel rays from any given direction are cast through the volume onto the viewing plane. The interpolation method normally used to determine the data value for each step on a ray is nearest-neighbour, but tri-linear interpolation can be specified, improving the image quality but increasing the time need to process the image.
SLICER
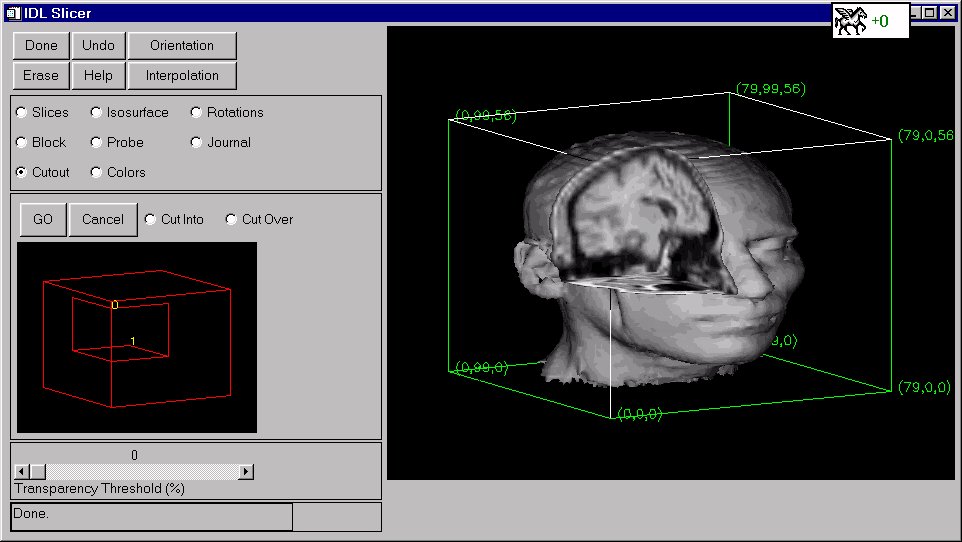
Volume data may be manipulated using SLICER, a widget based IDL application. When SLICER is invoked a new window is displayed, with a control panel on the left and a data display cube on the right. SLICER contains a number of different modes:
- Slices - Display or remove (expose) orthogonal or oblique slices
- Block - Display the surfaces of a selected block inside the volume
- Cutout - Cuts blocks from previously drawn objects. When CUTOVER is selected, the faces of the selected block will be displayed even if no object is currently displayed in the data cube.
- Isosurface - Draws an isosurface contour. The isosurface threshold may be adjusted using a slider.
- Probe - Displays the current position and data value.
- Colours - Select different colour tables and adjust the shading.
- Rotations - Alter the orientation of the data cube.
- Journal - Records and plays back files of SLICER commands.
Figure 3 SLICER interface displaying data from the example file 'head.dat'. The data was displayed using ISOSURFACE and then a CUTOUT removed.
Slices and cutouts are positioned and sized using the mouse in the active window. A box display on the left shows the position more clearly. Use is made of a three-button mouse to control a number of features. In Windows 95, when a three-button mouse was not available, CTRL-Left Mouse Button can be used.
By default bilinear interpolation is turned on, but this can be changed to nearest neighbour sampling to speed display.
Vector fields can be described in several ways:
- VELOVECT produces a two-dimensional velocity field plot, with an arrow at each point showing the direction and magnitude
- FLOW3 draws lines representing a 3D flow/velocity field.
- VEL procedure draws a velocity field with arrows following the field proportional in length to the field strength
- PLOT_FIELD procedure also produces a 2D field. Paths are traced from N random points, the length of which is proportional to the magnitude of the field vector.
Image files can be imported directly into IDL using the OPENR command, and displayed using TV or TVSCL, which scales the colour values to use the whole colour table. Contrast enhancing, smoothing and sharpening and rotations can be applied to the image.
IDL provides a set of routines for plotting data over different projections of the globe. 16 different projections are provided, covering azimuthal, cylindrical and pseudo-cylindrical projections. A database containing continent boundaries and other features is also supplied. The MAP_IMAGE and MAP_PATCH functions both allow images or other datasets to be warped onto the current map projection. The routines are similar but MAP_IMAGE performs better with a large input data set.
Graphics Multimedia
Virtual Environments Visualisation
Contents