|
||||
| Also available as an Acrobat File | 

|
|
Conclusions |
The Application of Digital Photogrammetric Techniques and Aerial Photography to
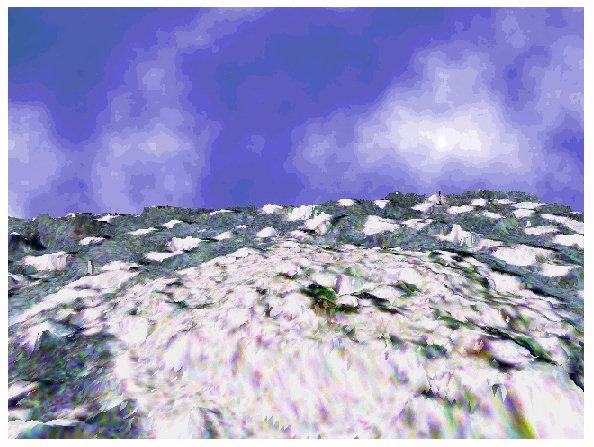
the Preservation of Archaeological Detail. 5 ConclusionsThe application of digital photogrammetry and aerial photography to the Copney Stone Circle Complex has provided a valuable dataset that can be easily stored, transferred and compared with data generated from similar surveys in the future. The DPW provides a rapid tool for visualization of the data and easy measurement of spatial relationship, absolute dimension and elevation of the stones. The accuracy of the data generated by the DPW is highly dependent on the scale of the imagery and the quality of the ground control points. The data generated by the DPW are readily transferred to image analysis, visualization and GIS software that can be run on standard desktop systems. The Perspective Scene capability of the DPW facilitates not only visually impressive representations of the CSC (Figure 9) but also the generation of specific height and angle views compatible with the generation of 3D walkthroughs using VRML (and therefore is very www-friendly). The accurate construction of DTM's allows:
Simple image analysis of the orthophotos generated from the DPW allows rapid characterization of the 2D stone dimensions and their positions.
6. AcknowledgementsThis study and its successors would not have been possible without the contribution of skills from specialists throughout the Queen's University. Specifically, we would like to acknowledge:
|
Graphics Multimedia Virtual Environments Visualisation Contents