
|
||||


Throughout the social sciences, excluding geography, spreadsheet software was frequently cited as one of the main visualisation tools in use. Of these spreadsheet packages Microsoft Excel was by far the most popular. Only one questionnaire referred to the alternative package Quattro Pro. One respondee wrote 'We used to use Harvard Graphics but they are now so non-standard that we cannot expect them to be installed.' Another described Excel and 'the industry standard'.
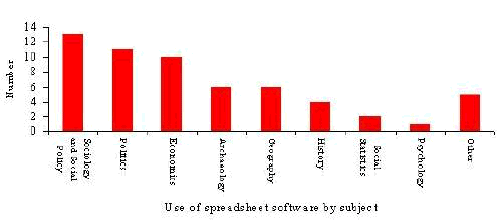
Spreadsheet software was used across a wide range of social science disciplines. We received most reports on the use of spreadsheets from academics in sociology and social policy, politics and economics but in almost all areas of the social sciences spreadsheets were being used. In fact, as we have suggested, spreadsheet software, and in view of the heavy bias towards the use of Excel, here we can really say Excel, is the visualisation tool of choice and practice in most social science subject areas.
Spreadsheet software, of course, does not have particularly complex visualisation tools. Later versions of Excel allow the creation of 3D graphs and, through a link with MapInfo, some mapping functionality. Based on the findings here, however, the limited visualisation functions of spreadsheet software were not fully utilised. Most users in the social sciences use spreadsheet software to store and manipulate numeric data. Some analyse quantitatively these data within the spreadsheet and some produce statistical graphs such as pie and bar charts. There were some complaints concerning the range and quality of these graphs but mostly these were from users who were using early (or very early) software releases.
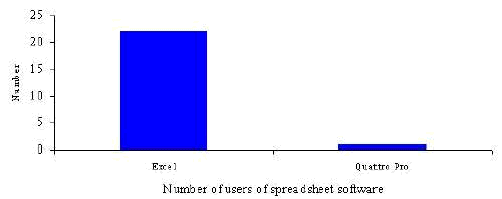
To reiterate, responses were received, and further details are available, for Excel and Quattro Pro.
Microsoft Excel
By far the most common piece of spreadsheet software in use in the social sciences - often bundled with other Microsoft Office products.
A number of different versions of Excel were in use including versions 4, 5, 6, 7, 95, 97. Excel was being used on Macs and PCs running Windows 3.x, 95 and NT.
Excel was generally being used in both teaching and research. Its main uses were for
In teaching Excel was considered to be useful as a tool for data presentation. It was used as the software in a first year 'Introduction to Statistics for Social Scientists' module with supporting workbooks and data supplied by the ESRC Data Archive. Feedback suggests that it was well received by students.
Excel was considered to be fairly easy to use. One respondee commented that the software was much easier to use than Lotus.
Specific advantages included the quality of graphical output, the speed with which graphics could be produced, the ease of graphing from raw data, the power of the package, its integration with other software, the fact that it is the industry standard, the linkage between spreadsheets and graphs, the high level of support available, as a means of data transfer because it is in such widespread use.
Specific problems with the software included insufficient variation in fill patterns for charts. Graphs were difficult to fine-tune. One respondee commented that graphing using Excel 5.0 was far from user-friendly and students in particular had problems with this aspect of that version of Excel. Another said that the graphs were poor. The software did not handle missing data well. With large datasets it was slow. A user suggested that in version 5 the manuals and help facilities could be improved.
In terms of software development, it was suggested that some of the most powerful features of Excel were available as add-ons and their presence was not readily apparent. At the other end of the scale it was suggested that Excel should be designed in a series of mini applications which the user could select based on their specific requirements. It was suggested that Excel should be linked to an inbuilt OCR system so read data direct into the spreadsheet. Better functionalist in determining graph layout was also proposed together with an enhanced range of graph types.
Interestingly some of the most critical comments concerning Excel came from a respondee outside the social sciences - in a biology department. He describes Excel as cumbersome. The software occupies too much hard disk space and does not store data efficiently (Others make similar comments). He argues that it suffers from being an all in one package including a spreadsheet, database and graphing program. As a consequence none of the sub-applications are optimised - the user gets the worst of all possible worlds. Perhaps most damming of all, it is argued that Excel has no features better than competitors.
Quattro Pro
Compared to the spreadsheet software Microsoft Excel very few respondents reported using Quattro Pro in their work.
In the social sciences we found users using versions 6, 7 and 8 of the software. The software in all cases was found to be used for both teaching and research. The chart features of Quattro Pro were generally used for lecture presentations and in the preparation of material for publication. The package was also used for statistical analysis of datasets.
Amongst the positive views of the software was that it was easy to use, the on-line help facilities were very good and that the range of statistical tests were extensive. One respondee wrote 'Very easy to use. Statistical techniques are very comprehensive. You can compute almost anything very easily.'
Corel Quattro Pro version 7 was specifically criticised for providing poor printer support, surprisingly when used with Hewlett Packard printers. In particular visualisations appearing on a computer monitor were not accurately rendered to hardcopy.
Interestingly, against the backdrop of the popularity of Excel, one respondee wrote 'I shall probably shift to Excel in 1998 because of LSE support focussing on MS Office.'
Graphics Multimedia Virtual Environments Visualisation Contents