 |
||||


3.2.3 Statistical software
We received 48 questionnaires related to the use of the data visualisation functions of statistical software in the social sciences. From these results it is clear, however, that statistical packages are primarily being used to store, manipulate and quantitatively analyse data. The graphics functions of these software packages were not widely used.
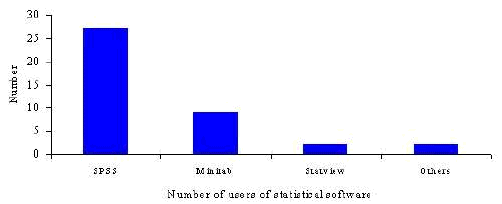
As the graph shows, SPSS was by far the most popular statistics package in use in the social sciences. In total around 60 per cent of users of this group of software were using it. Minitab was the next post popular statistical package with around 15 per cent usage. SAS was next most popular followed by Statview. For other statistical software only one questionnaire reply was received in each case.

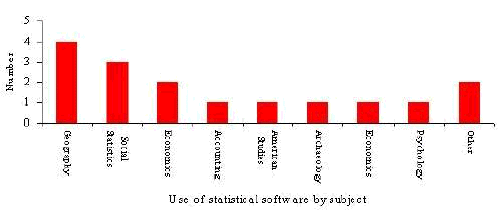
Statistical software was widely used throughout the social sciences. Unlike visualisation tools such as GIS software it was not predominantly used in any one subject area. We received most reports on the use of statistical software from geography, social statistics and economics. We received one questionnaire each from a number of other subject areas. Interestingly, and no doubt a product of the limited penetration of this survey, we received no reports at all on the use of statistical software in history.

In detail responses were received for the 13 different packages.
ExperStat
We received one questionnaire referring to ExperStat used on a Macintosh OS 7 or 8.
ExperStat was used in teaching as a straightforward introduction to ANOVA, but the software also has the capability to carry out other statistical tests. The software's particular strengths were listed as
LIMDEP
We received just one brief report on the use of LIMDEP, an econometric package in this instance used in research. The software was described as being fairly easy to use and very useful. Its main value was in the increased productivity it afforded.
Matlab
One respondee discussed the use of MATLAB in teaching. The software was described as being neither particularly easy nor difficult to use. It was viewed in high regard however.
Specifically the software was used for
In terms of software development an interactive graphic editor would be of value.
Microfit
We received one report on the use of Microfit for econometric estimation in teaching and research. Microfit was described as both being very easy to use and very useful.
The software's main advantage was described as its menu driven interface. This was also listed as its main disadvantage!
The most useful software development would be the ability to write macros to be inserted into the current user interface need to keep up with statistical developments.
Minitab
Minitab was the second most popular statistics package in use in the social sciences. It was used both in teaching and research although some users regarded it as a more limited research tool. No one found Minitab difficult to use and it was generally regarded as being either 'very easy' or 'easy' to use.
Minitab was used for:
SAS
Surprisingly we received only one questionnaire describing the use of SAS. In this instance SAS was being used in both teaching and research.
Whilst SAS was regarded as being very useful, it was also described as being very difficult to use.
Specifically SAS was described as being flexible. The graphics module is part of very powerful statistical and data transformation package. Its main disadvantage was its difficulty of use - SAS is not a package for the novice user.
The most significant software development would be an easier to use front-end for charts etc. along the lines of what is available in competitor packages such as SPSS.
Schema
We received one report on the use of Schema in research. The user felt that the software was both easy to use and very useful. Schema was used for data analysis, data manipulation and data representation.
The software was particularly valuable because of its speed and ease of use. No drawbacks were identified.
SECOS
SECOS, produced by Statistics for Education, is available for both DOS and Windows platforms. It offers a front-end to statistical datasets allowing data manipulation, analysis, graphing and mapping. The software is particularly useful in teaching quantitative techniques to students.
We received one report on the use of SECOS for teaching levels I and II and Masters students in Sociology and History.
SECOS was considered to be very valuable and fairly easy to use - 'Sociologists can use it anyone can!!!'
SECOS was used for:
SigmaStat
This statistical package was not widely used in the social sciences in the United Kingdom. In fact only one questionnaire made reference to the software from a respondee in the United States. SigmaStat requires a 486 IBM PC running Windows95.
The respondee used the software for both teaching and research. Specifically the software was used for descriptive statistics, chi-squared analysis, regression analysis and t and z tests.
The software was considered to be easy to use and within the constraints of the software very useful - 'This is a good starter package. Not very powerful, and not all that flexible, but simple and instructive.'
It was considered to be particularly valuable as a teaching tool. The software includes an analysis wizard, which helps to determine the best analysis to run. Following statistical tests it gives an indication of significance levels where appropriate.
SigmaStat is limited in that data inputting is not as straightforward as with some other packages. It will not allow alpha data to be coded and the range of statistics is limited compared to some other software.
The software could be improved by upgrading the analysis wizard and the interface more generally.
SPLUS
Another statistics/graphics package used infrequently in the social sciences. The software was used in research and for the creation of diagrams for papers. It was considered to be very useful but not particularly easy to use.
Particular uses/advantages of SPlus included the good 3D graphics and the non-parametric output. However, some programming using the SPlus language is usually required. The language has become easier to use over time. Also it is often hard to get things exactly right re: margin sizes etc.
SPSS
SPSS was by far the most frequently used statistical package in the social sciences. In total 27 questionnaires were received describing its use. SPSS was used in both teaching and research. Some respondents used SPSS solely in teaching, others solely in research and others in both activities. Generally SPSS was found to be 'easy' or 'very easy' to use. A small number of respondents found the software more difficult - particularly when students were being taught to use it. Virtually everyone found SPSS to be a 'very useful' tool.
The software was used in a range of applications including specifically:
'I prefer to use other packages for my research. I think my students find it quite difficult to use.'
'I provide the opportunity for students to obtain their own data rather than use that provided by the manufacturer. This makes learning personal and meaningful.'
'After an initial introduction to the system if becomes quite routine and reasonably easy to use.'
'It is sometimes difficult to get undergraduates into the package quickly although the later versions are a big improvement on earlier versions.'
'Once students understand the way that SPSS operates then they find it easy to use the software. The only problem that I can see is that it can be too easy for students to undertake statistical tests without understanding what and why they are doing it!'
'SPSS is far superior to SAS for the PC, although it has weaknesses in graphic output and some other basic operations needed in statistical analysis.'
'Still believe SPSS hasn't moved to true windows version. The 7.1 is a move in the right direction, I welcome some of the new features, interaction diagrams, some post hoc testing. The graphics environment is still slow and basic.'
Statview
Another statistics package rarely used based on our survey results. Statview was used primarily for generating statistical output. The software was considered to be 'almost idiot-proof' with easy output - the reason given for not using SPSS. The graphics was described as useful but the range of analyses were limited. The software would be improved by increasing this range.
XLISP-STAT
Good reliable software but a steep learning curve. Full programmability in a real programming language makes the system flexible, but a little harder to use than most.
Specifically the software was used for:
The software could be improved through the introduction of some fairly specialised statistical techniques, such as spline smoothing - which may be used in conjunction with visualisation.
Graphics Multimedia Virtual Environments Visualisation Contents