
|
||||
The aim of this unit is to introduce you to thinking about the data that you are working with and about the processes that are necessary to make effective use of this information. You will have the opportunity to create some new information.
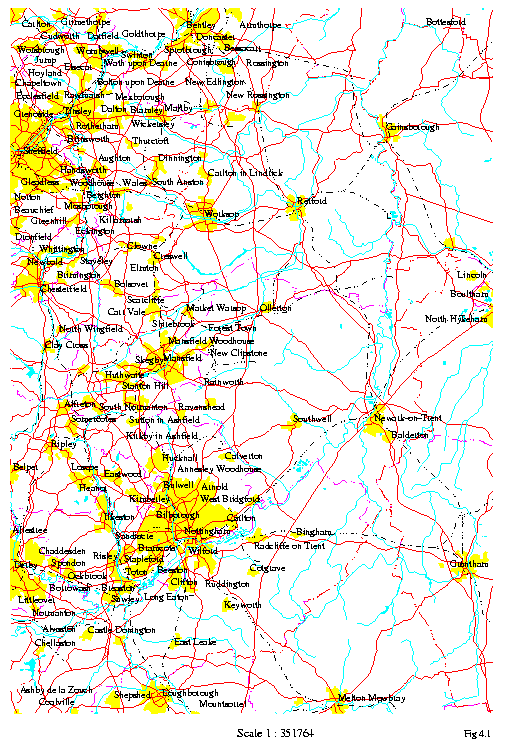
Data for use in a GIS comes in a wide variety of forms. Fig. 4.1a shows an example of spatial data but associated with this is non-spatial data (Fig.4.1b), in this case statistical returns for specific towns shown on the map. (See section 1.2). These latter are examples of quantitative data with which one can carry out calculations (e.g. mean number of banks in the three towns). But the data could also be merely qualitative, e.g. the different categories of land use shown in Fig. 4.1a..
Although we may initially think of maps and their associated attribute data when considering GIS, Arcview (and other GISs) can also deal with many other types of data, so long as there is some form of locational key. Examples of data sources, other than maps, include census returns, customer address lists, (aerial) photographs and satellite images, GPS (satellite navigation system) position reports, etc.
All forms of photography are handled, initially at least, as an image. An image may just be a picture, which could be regarded as representing the attributes in visual form, e.g. a photograph of a building offered for sale whose location is shown on a map in a particular Arcview theme. Alternatively the image could contain spatial information itself e.g. an aerial photograph or a satellite image of an area of land could be imported into an Arcview theme and used as a baseplan for the construction of additional themes.
In the previous units you have been using data that has been collected and input into the GIS ready for you to use. Eventually you are almost certain to have to collect some data for yourself. There are a number of issues that need consideration even before starting to collect this information.
4.1.1 Collection of data
Data obviously has to be collected. Primary data is that obtained directly from a field survey. However, more often than not you will be obtaining data from someone else, who has either collected the data themselves or who is some type of 'middleman', or distributor, acting as a marketing agent between the collector and the GIS user.
Whatever the potential source of the data might be, some questions need answering beforehand:-
What data are required?
What sort of resolution is required of the data?
How accurate / precise does the data need to be?
Basic questions such as these must be asked throughout any project. If data are selected which cannot provide the required information, then the project will be a failure from the start.
What data are available?
These may include base maps, upon which you may wish to add your own information, such as Ordnance Survey maps for the UK.
What form are the data in?
What form do you need the data in?
Thus the following questions must be asked about each potential dataset:
What needs to be done to this data in order that it may be used?
What is the precision of this data?
What is the accuracy of this data?
Have you Copyright permission to use this data?
Is it Ethical to use this data for this purpose?
In the end it is necessary to decide whether the available data is acceptable for the purpose for which it is required. By such a definition, there is no such concept as 'good' or 'bad' quality data in a theoretical sense, but only in the sense of the purpose for which you wish to use the data. Such an idea, is, however, compromised by cost. So a more pragmatic definition could be represented by the equation:-
In other words, it usually comes down to economics and how much one is prepared to pay for the data!
4.1.2 Types of data
Data to be imported into a GIS can exist in a number of different models e.g. tables of numeric data, alphabetic text, paper plans, photographs, digital files.
Obviously, of these models of data listed above, the digital data (whether on a floppy disk, hard disk, CD Rom, network server etc.) may simply be able to be loaded into the GIS as you would do with any other computer application like word-processing etc.
The other models will certainly require some form of preparation before they can be used in the GIS. Information obtained from printed tables of numeric data and alphabetic text can be typed in to Arcview, or a text editor, to annotate spatial information, boundary polygons for example, or to provide a database or file of information.
Since computers can only work with digital information, any non-digital (called analogue) data needs to be converted to digital form before it can be used in a GIS. Spatial information, from printed or drawn maps or plans, must be digitised before it is available for use; photographs, etc., must be scanned to obtain a digital representation.
The method of digitising that needs to be adopted depends not only upon the nature of the source information but also upon the purpose to which the information is to be put. For example, a photograph of a building offered for sale may need only to be linked with the property address but an aerial photograph of the extent of flood waters may also need to be geo-referenced in order that the area flooded may be aligned with other mapped data.
4.1.3 Different ways of representing spatial data
In the previous Units you have been working with information which is, essentially, represented by lines. The lineation of roads, rivers, and canals, the boundaries of responsibility for units of local government, etc. Locations for these have been found in terms of Grid References, or co-ordinate pairs. This, vector model is one data model for representing features of the real world:
VECTOR - this is where the data is recorded as a series of co-ordinate points. A linear feature, such as a road, is recorded by means of two, or more, pairs of co-ordinates; a point feature, such as a specific building, might be recorded by means of a single pair of co-ordinate values. For a line which changes direction co-ordinates are also required for each point where the line changes direction. The linear representation is termed a polyline, whilst the specific location is termed a point. A bounded area, such as a lake or an administrative unit is represented by a series of connecting, and closing, lines, which is termed a polygon.
Points are very useful for representing features which have location but no areal extent, or which at the scale at which the data is collected have no effective area. Examples might include the locations of bus stops, Post Offices, Information Points or car parks.
Polylines are ideal for representing linear features, such as roads and other transportation features, rivers and canals, pipeline or cable services, etc. Again, features represented in this form have no effective area.
Polygons are used for features which have area, and thus clear boundaries. Examples include the administrative areas, discussed earlier, lakes, property boundaries, planning regions, etc.
RASTER - represents continuous areal information, sampled and recorded as a framework of rows and columns where a single piece of information is stored in each grid cell or pixel. Each cell or pixel represents a value for an area of reality and have the same size and shape. Most GIS deal with square cells or pixels, though some can handle rectangular or even hexagonal cells.
The raster is ideal for representing information which is continuously varying, such as altitude, temperature, land use, etc., but has the disadvantage that all cells or pixels for an area must be present, even if there is no useful information conveyed by the values recorded for a particular cell or pixel.
Vector or Raster? The choice can depend in part upon the source of the information but is mainly dependent upon the use for which the information is required. The co-ordinates for the vector representation may be collected with a high degree of precision - surveyed to the nearest millimetre, for example, and only those points at which there is a change of direction need be collected for a linear feature. This can produce data which is very compact yet very precise. In contrast, for the raster model, all cells must be collected for the area of the dataset, and all cells must have the same size. This makes for large datasets - potentially containing very little information. Halving the cell size results in squaring the number of cells. There is another effect of the use of a regular framework of cells or pixels: this is that the only directions that can be represented accurately are those in the direction of a face of the cell. This limits the suitability of the raster model for the representation of linear features, especially those where the delineation must be accurate - such as a property boundary.
4.1.4 Digitising data
Where spatial information is to be digitised, choice of digitising technique involves not only consideration of the form and format of the data but it is also necessary to consider what the data is to be used for. For example, if distances along roads are to be measured then spherical co-ordinates (degrees of latitude and longitude) are not too helpful. Also, the size of the area will determine whether curvature of the Earth has to be taken into account and hence the type of map projection used.
A plan or image can be scanned, in which case it will be imported in a raster format. With this process paper-based data is captured using a xerographic type technique to determine the presence or absence of a mark at a point on the page. This process is ideal for the capture of information such as the photograph of property offered for sale. Unless you have the Spatial Analyst extension available with ArcView 3 you cannot analyse this data but can use it as a base plan for creating new themes.
Once the source is scanned, the additional techniques of mark capture or OCR may be used to extract digital numeric, or character, information from the scanned image.
Mark capture is a similar type of process involving photo-recognition of marks on paper, like the pencil 'bar' marks on a multiple choice answer form. This technique can be useful for the capture of field measurements, using a technique similar to that also sometimes used for market research questionnaires.
Optical Character Recognition (OCR) is similar to these previous two processes but specifically involves machine recognition of a printed page into ASCII characters in a file which can then edited etc. like text typed in.
Remote sensing (e.g. using satellites) can automatically record spatial data as raster-based digital images. These are then typically processed using tools such as the ArcView Spatial Analyst extension, or specialist image processing software. Data such as aerial photographs, after scanning, may often be processed in a similar way.
Spatial data from a paper map, say, can also be digitised by using a digitising tablet or by using the mouse. This method, which mimics the actions of a draughtsman by tracing the required information is the traditional means of capturing spatial information. ArcView includes, as an Extension, a digitising tool. This tool, which currently only runs on Windows platforms, requires a digitising tablet or table to be connected to your computer. At this stage using the mouse is probably the most useful and straightforward example of data input to actually try out:-
Exercise
In this exercise you will learn how to convert information that is already in a digital form, but collected for some other purpose, and add to it other information so as to create a new spatial dataset.
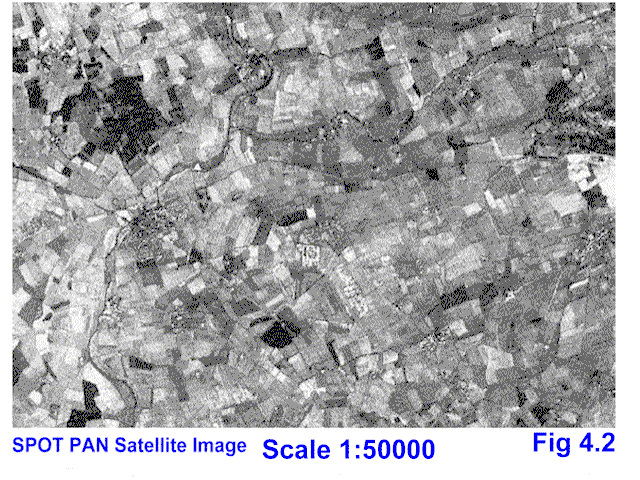
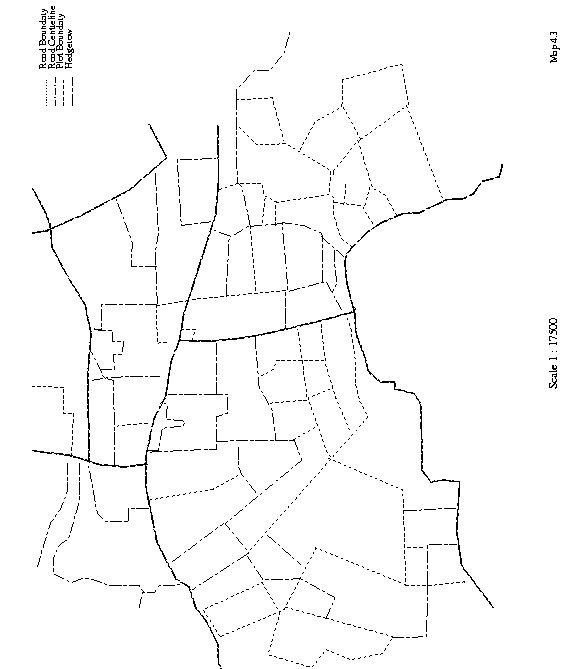
Fig 4.3 shows a crop plan for a mixed farm, together with the hedgerows that divide the field. An OS-type base plan (which cannot be edited itself) is available and you are required to enter data concerning the crops grown, their area and the types and lengths of hedges.
In ArcView open a new Project and new View before adding the theme with the farm baseplan (give file name here).
You now need to create a new Theme for some of the data to be entered. Click View on the Menu Bar and then New Theme from the pulldown menu. In the subsequent dialogue box choose the appropriate Feature Type (polygon, line or point). For crop types these would be polygons and as each Theme can only be of one feature type you will need to create a second new Theme for the hedgerow.
Before creating anything in the new Theme make sure that the Map Units and Distance Units are set in the View Properties box (as described in Unit 2).
Now you will trace around the boundary of a field to create a feature for your new Theme. Click Theme on menu bar and then Start editing. Ensure that the shape you are tracing over is maximised in the window by using the Zoom In icon (the one with a + on it) to drag out a rectangle which just encloses the extremities of the shape. You can then maximise the accuracy with which you draw the polygon.
Now move the cursor over the Draw button and pull down until the cursor is on the polygon symbol and then release. Trace around the field, clicking once every time you need to change direction. When the polygon is completed click twice when the polygon will appear selected. Continue with the other fields until you have traced them all. Move cursor to Select button and press to switch off Draw tool before you end up starting another unwanted polygon! If no further polygons or editing are required click Theme on the menu bar and then Stop editing.
If the shape of a polygon requires editing first make sure that it is still in editing mode (has a dotted line around the check box). If not then click Theme on menu bar and then Start editing. Click Select button and then click inside polygon to select. Click again to show vertices of polygon. When in a vertex the cursor changes to a cross-hair type and can be used to drag the vertex to a new position. When complete, click outside the polygon to deselect and then click Theme on menu bar and then Stop editing.
When you have finished drawing all the polygons open the theme's Attribute Table. You will see that the number of records corresponds to the number of polygons you have drawn but the only field will be shape. You will now need to create new fields for area and crop type. It's also a good idea to have an ID field so you can give each feature a unique identity. Click Table on menu bar and then Start editing (or click Edit tool button). You can now add additional fields by clicking Edit on menu bar and then Add Field. Don't forget to specify the data type (number for area and string for crop type) and to give the field a name in the Field Definition box.
When you have created the area field you can fill in the areas of all the polygons by first making sure that field name is selected and then clicking the Field Calculator button. In the Field Calculator dialogue box double click shape in the list of fields on the left and you should then see [shape] appear in the box in the bottom left hand corner. Now immediately after this type .ReturnArea so that the bottom left hand box should now contain the expression [shape] .ReturnArea. Click OK and areas should be filled in for all your polygons.
To do add crop type or ID number to the other fields click the Change cell value icon. Add the appropriate value and then repeat for the other cells. When you have entered all the data click Table on the menu bar and then Stop editing before returning to the View.
To show the fields by crop type in the View, double click the Field Theme in the View Table of Contents to call up the Legend Editor. Click Field pull down arrow and select Crop Type. Double click the symbol of the first crop type to both select it and call up Symbol Palette. If you want to use colour for that particular class of feature ensure that the Fill button on Symbol Palette is pressed and that choice is anything but white (and that it is set for foreground in case of polygons). Then click Colour button and choose colour. Repeat for the other crop types. Close Symbol Palette and Legend Editor when finished.
Each time Legend Editor is changed/closed there is a tendency for it to select new colours randomly when it is re-opened. One way of overcoming this is to create the legend you want and then save it as a named file. It can then be loaded when required for use. When doing this it is a good idea to set the full range of feature categories first and then save the legend. Otherwise, if you have to amend the legend you'll probably have to reset the whole range of colours again!
Now try repeating this exercise with the hedgerows. Don't forget that the new theme you will need to be a polyline theme.
You may now wish to repeat parts of the exercises in Unit 2 in order to produce a hardcopy version of your work in this exercise.
Data, when it first arrives, will almost always need some form of conversion in order that it can be used in your work. This may involve converting a file into a form acceptable for your computer, or translating location, coordinate, values to the same system as you are using for other information.
4.2.1 Geo-referencing and co-ordinate conversion
The spatial data captured above will be recorded using the coordinates of the source material, or the scanner. In the case of exercise 4.1, the crop plan, this data is already in map coordinates - those of the British National Grid. Where the source data has been scanned, the coordinates are those of the scanner; in this case they must be converted to reflect their position in the real world. This is called geo-referencing. ArcView has but limited built-in facilities for geo-referencing, and to perform this operation on (scanned) images requires the ArcView Spatial Analyst optional extension. Images will not, therefore, be discussed further in this unit.
Sometimes digital data is available, but is recorded using a co-ordinate system which is different to that being used for other data, and the co-ordinate systems must be aligned so that the data will match up. This change of co-ordinate systems is called re-projection.
In order explain the next steps, it is necessary for us to think a little more about co-ordinates.
In Unit 1 the concepts of co-ordinates and the National Grid were introduced. Brief mention was also made of latitude and longitude which are measured in degrees. The reason for this is that the Earth is a sphere and not a simple flat surface as maps, at first sight, would suggest! Therefore, the latitude and longitude of a particular feature on the Earth's surface give the angles relative to the centre of the Earth's sphere which define its location (see Fig. 4.4 cut-open Earth to show angles of lat & long for part. location). Angles have the advantage of being independent of surface shape and so do not depend upon a flat surface like measurements on a piece of paper but are not convenient for the measurement of distance between locations.
Since it is not possible to accurately represent the curved surface of the Earth on to a flat medium, such as paper, some approximations must be made. The extent and nature of these approximations will depend upon the proportion of the earth's surface that is to be represented and the purpose for which the product will be used. This process of approximating the curved surface on to the flat one is termed Projection and in the specific case of geographic representations, Map projections.
ArcView provides facilities for different map projections, and for georeferencing image data, such as satellite imagery. There are no built-in facilities, other than within the Digitiser Extension for controlling a digitising tablet or table, which support georeferencing of tor information, nor for advanced correction of photography (ortho-rectification). This is an area which often requires the capabilities of the more advanced GIS, such as Arc/Info.
The issue of converting data supplied in one map projection to another is considered in more detail in section 4.3, Data Integration.
In almost every real life project it is necessary to bring together information from more than one source. The moment this is done there are problems to resolve that result from this information having been collected at different times, or by different people, or using different units of measurement. The process of bringing different datasets together, of resolving so far as is possible these problems, is called data integration. Perhaps the classic example of a problem of this nature is that of trying to work with data from different censuses, where the enumeration area - the basic unit of aggregation - may represent a different group of households from census to census. In this instance the problem lies between different instances of what is apparently the same dataset. The problem may get more significant when different data sources are involved!
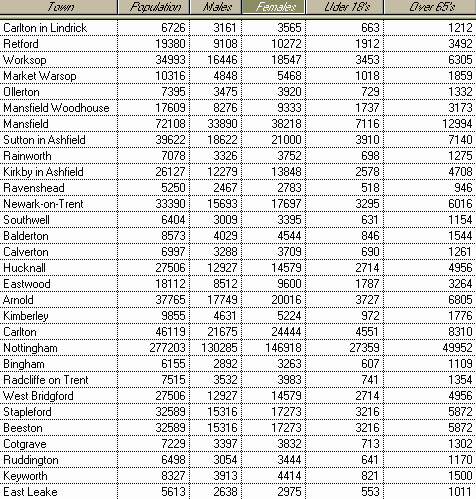
Both spatial and non-spatial data can also vary considerably in scale. For example, the map in Fig. 4.1 is of a small scale and the data associated with it is fairly general in nature. In contrast, Fig. 4.3a is a much larger scale map and the data associated with it (Fig. 4.3b - information about the individual fields and crops grown) is much more intricate in detail.
The concepts of scale, resolution, precision and accuracy (section 4.1.1) apply equally to spatial and non-spatial data. For example, non-spatial data on population sizes of cities may be given in tens of thousands (relatively coarse resolution) or in hundreds (relatively fine resolution). This would then determine the precision of the data (e.g. to the nearest hundred etc.). The accuracy of the data would be affected, for example, if significant numbers of people had moved out of the city since the population size had last been estimated.
One important principle to remember is that processing in a GIS (e.g. overlaying themes derived from differently derived sources and observing any relationships between them), may exacerbate any errors between such sets of data so it is important to know, as far as possible, about the quality (i.e. resolution, precision and accuracy) of the original data before it is processed. For example, spatial data intended for display at a scale of 1 : 250000 will most likely contain generalisations of detail; a line 1 mm wide would represent a feature 250m wide, so widths of roads and most rivers cannot be depicted. If such data is then combined with a dataset intended for display at a scale of 1 : 2500, it would be unlikely that the representations of the various features would align. With non-spatial data the size and delineation of the collection unit becomes important.
4.3.1 Integration of datasets
Where spatial data, to be used within ArcView, is stored in geographic coordinates, ArcView will automatically reproject to the projection and scale defined for a View, in the View Properties. ArcView cannot integrate spatial data which is stored in other coordinate systems, although it can work with multiple datasets stored in the same coordinate system.
Where data is collected to different spatial aggregations, ArcView can be used to combine smaller units of information in order to standardise at the coarser resolution. It is not possible to unpick generalisation, so it is always the coarser resolution which wins.
ArcView can also integrate spatial data in different formats. For example, some of the data used in this tutorial have been in ArcView's shape format, some others may have been in Arc/Info internal format. ArcView will read Arc/Info format data but you cannot change any of the contents. ArcView can also read datasets created in CAD software, especially when in AutoCAD dxf format.
Because ArcView uses dBase format database files, it is easy to share tabular, non-spatial, information between ArcView and spreadsheet software and database systems, such as Quattro Pro or Microsoft Access. Attention will have to be given to ensuring that one of the database fields is a valid index, or key, to your spatial information if you wish to use this information on a map display or in analysis. A common key, for such purposes, is location given as coordinates. It may seem obvious, but it is essential that coordinates used in this way are expressed in the same way as those being used within the map data. For example, spatial, map, data which uses UK National Grid coordinates will use these as numeric, metre, references. The coordinates in a database table to be related to such coordinates must also be in the full, numeric, form.
All this data, spatial and otherwise, presents the possibility of confusion between many different data objects, each of which may occupy one or more computer files. Spatial data tends to be voluminous, so the amount of computer disk space required may also be large. This section explains something about the various files that are usually associated with ArcView.
4.4.1 Managing ArcView files
The files used by ArcView comprise a database of the spatial component, the .shp file, and the attribute data, the .dbf file. These are very much like those used by other database and spreadsheet tools, indeed the .dbf file may be read with any software which understands the PC dBase database file format. In addition to these data files, ArcView also a file to maintain the index between the spatial and attribute data, the .shx file - but this file is managed by ArcView and there is never normally any need to touch it directly.
In addition to the data files, ArcView also creates project files, .apr, in which you can save a complete working environment, together with any Avenue scripts or customisations you may have created.
Because spatial data tends to be large - a typical OS digital map may occupy anything between 8MB and 20MB for a 0.5km square area - existing data files (e.g. digital maps with associated attribute tables) will probably be kept on a hard disk or network server. You have seen how such a file can be brought into ArcView in the form of a theme. If you then carry out some processing of the data (e.g. as you did by selecting a particular set of canals in Unit 3) and want to save what you have done you do so in the form of an ArcView PROJECT. However, the project files do not contain the data but remember where it was located and what had been done to it for that particular project. Therefore, when you open a project you have saved previously, ArcView will automatically seek out the relevant data, import it and manipulate it for that project.
Another reason for mounting data on a server may be to comply with the conditions of copyright licenses. Virtually all spatial data available in the United Kingdom, even throughout Europe, is protected under copyright law and its usage is licensed. It is a legal duty of both institution and data user to ensure compliance with such licenses. The Bartholomew and Census Boundary data you used in the previous units is copyright in this way, and may not be used other than as a part of this tutorial.
However, there may be times when you have created your own theme(s) in the form of a shape file, e.g. as explained above, and, for your own piece of mind, you may want to save such a theme on a floppy disk. You need to know that although when you 'add theme' to a project, or use 'convert to shapefile' from the Theme menu of a View, it appears as a single .shp file in the 'add theme' dialogue box, it does in fact consist of three different files, all with the same name but with different file types. These are:- .shp .dbf .shx
If you wish to remove an ArcView shape file, it is necessary to delete all three of the files. ArcView does not provide a tool to delete files.
You may move files from one disk directory to another (remember to move all three together!) but if you do and you have referenced them in a saved project (.apr) file, ArcView will no longer be able to find the files.
Therefore, if you are copying on to a floppy disk remember to copy all three files for a particular theme. Similarly, if you wish to delete a shape file it is necessary to delete all three files of the set.
In this unit you have learned how GIS works with different forms of data and about the different ways that real world objects may be represented in ArcView Themes. You have learned that it is necessary to investigate information about data that you wish to use, such as sample size, resolution, precision and accuracy. You have learned that it is sometimes necessary to make use of information which may not be ideal because of the cost, or unavailability of better alternatives. You have also learned about some of the issues involved in bringing different datasets together, and about managing an ArcView workspace. You have experienced some of the pain of digitising spatial data.
You should now be equipped with the basic knowledge of how to use ArcView, of how to get information into the GIS, how to use the GIS to analyse the information and how to display, to communicate, your findings. The next stage is practise! To get more familar with the GIS and to use it for something for real before you attempt more advanced activities, such as are provided in the various ArcView Extensions, such as Spatial Analyst.
Chapters 4 and 6 of Principles of Geographical Information Systems for Land Resources Assessment, P. A. Burrough, 1986, Oxford University Press.
Graphics Multimedia Virtual Environments Visualisation Contents