Area charts are used to emphasize the volume or size of a data series over time. There are 2-D and 3-D versions of the Area Chart. In this section of the tutorial we create (from scratch) a 3-D Area Chart and cover the following activities:-
Plotting a chart from the chart view
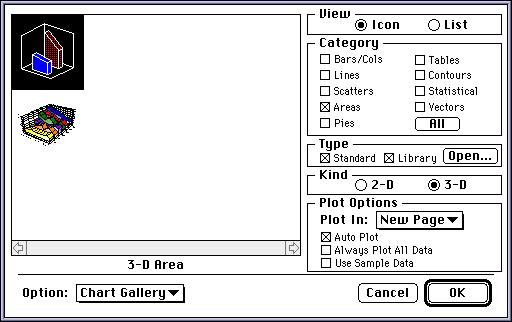
Open a new chart (select New from the File menu), then choose Chart Gallery from the Data menu. The Chart Gallery dialog box appears. Click on Areas in the Category section, and 3-D in the Kind section, as below:-

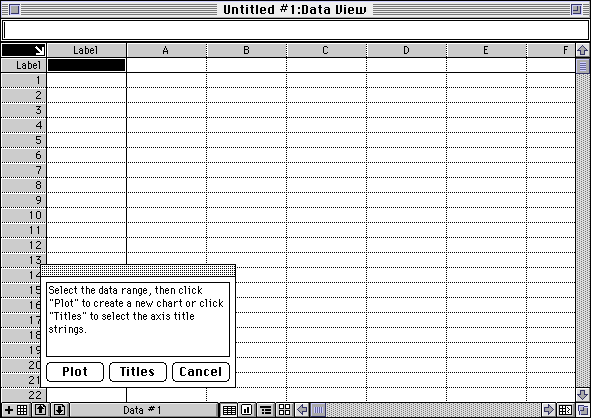
If you move the cursor over the chart icons, the chart name appears immediately below the chart icon window. If you click on one of the chart icons, it will be selected and a description of its functionality will appear in the Description section. Select the 3-D Area chart and click on OK. The current Data page appears together with a "floating window" as follows:-
Importing Data
Click on the floating window’s cancel button. Now, choose Name Page from the View menu and name the Data page "3-D Area Data", thus:-
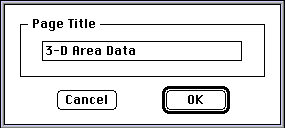
Click on OK.
Now, select Import... from the File menu and choose the Excel data type before selecting the file Buying Trends from the Sample Files folder in the Deltagraph4.0 folder.
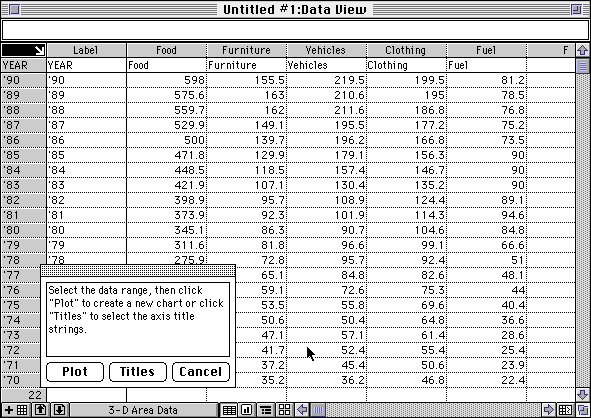
Data from this Excel file should now appear in the currently active Data page, as follows:-
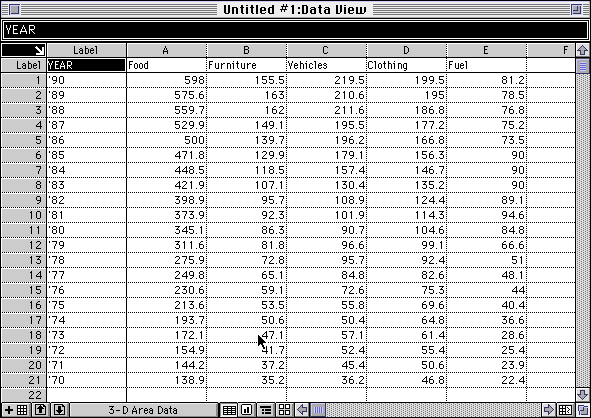
Now choose Show Labels from the Data menu. This option allows you to scroll your data and still view your column and row labels. The column letters are replaced by the column labels and the row numbers are replaced by the row labels.
Adding Chart Titles
Re-select the Chart Gallery and select a 3-D Area chart as before. The floating window will reappear:-
Adding Chart Titles
Click on Select All in the Edit menu to select all data on the current Data page.
Click Titles in the floating window. The floating window expands. (You can move it by clicking its Title Bar and dragging it).
Click on the Data page at the intersection of cell "23" and cell "Vehicles".
Enter "Year" and press Tab, enter "Consumer Goods" and press Tab, and enter "Dollars" and press Tab.
Now, click on "Year" in the Data page and click on "X Title" in the floating window. Notice that the cell number appears next to the X axis title button on the floating window.
Press Tab to select "Consumer Goods" and click on "Y Title" in the floating window. The cell number appears beside the Y axis title button.
Press Tab and click on "Z Title" in the floating window. The cell number appears beside the Z axis title button.
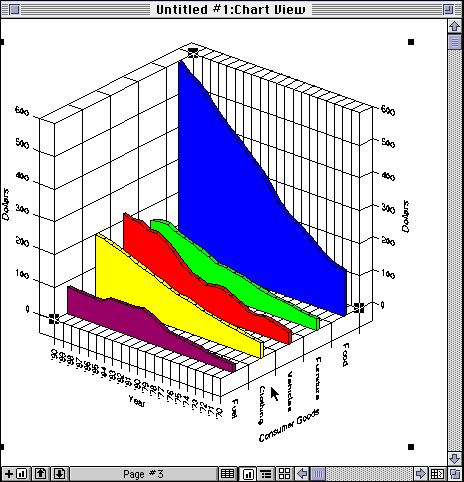
Now, click "Plot" in the floating window. Deltagraph plots and displays the 3-D Area chart as follows:-
Resizing the Axis
Select the chart. Object handles (small squares) and axis resizing handles (large squares) appear to show that the chart is selected.
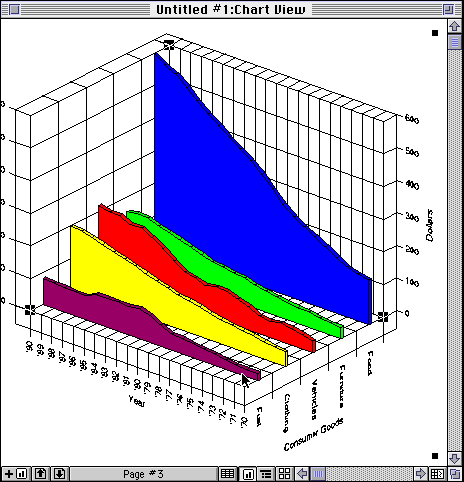
Click on the bottom right axis resizing handle and drag it to the right. The chart reappears with the expanded axis allowing more room for the category labels on the bottom left side, thus:-
Changing the Text Attributes of Axis Labels
Hold the <Control> key down and click on each of the axis labels, "Year", Consumer Goods", and "Dollars". This will select each axis label simultaneously. Now change the size of the axis labels to 18 by selecting Size from the Text menu and then selecting 18. In exactly the same way you can change the text font and style, and other text attributes. If you wish to modify labels individually, simply select them one at a time.
Using the "Options..." Command
Making sure that the chart is selected, choose Options... from the Chart menu. The following dialog box appears:-
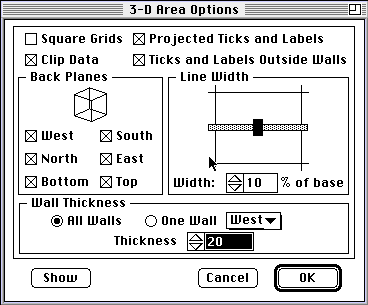
De-select "Projected Ticks and Labels", change the "Line Width" to 65%, and enter a "Wall Thickness" of 15, and click on the Show button to preview these selections without modifying the chart permanently.
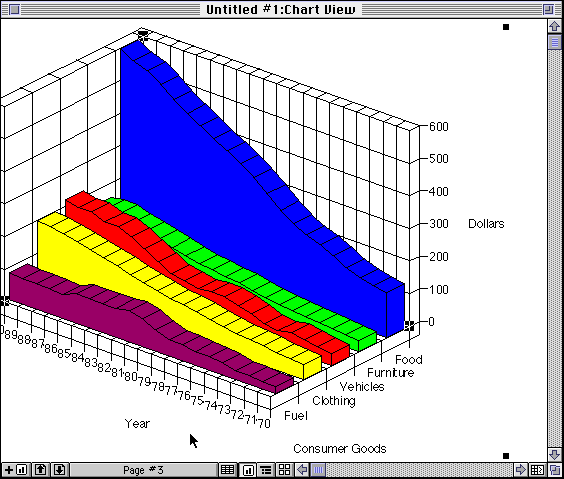
If you’re happy with the changes, click on OK to modify the chart, which now looks like:-
Rotating Labels
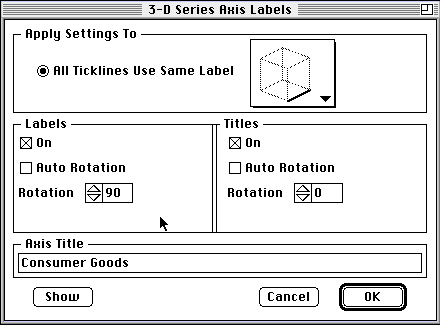
You can rotate any of the axis labels or titles on any of the charts you create. For example, for the current 3-D Area Chart:-
In the dialog box which is displayed, set the Labels rotation to 90, as follows:-
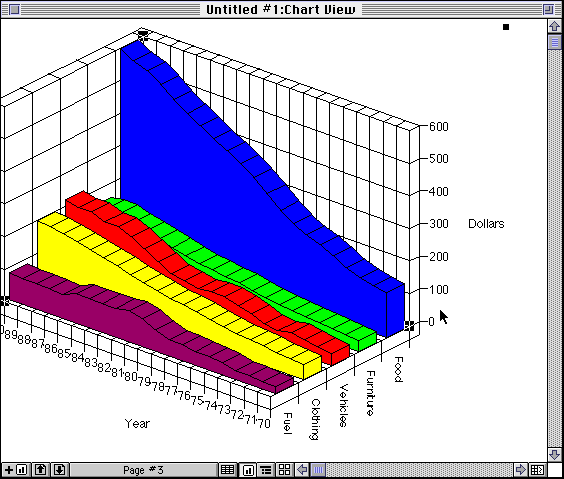
... and click on OK. The chart will be changed as follows:-
Changing the View of 3-D Charts
To modify the viewpoint of the 3-D Area Chart:-
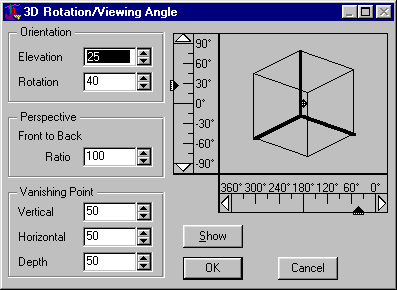
Now, change Elevation to 18, Rotation to 37, and Perspective to 60 (just type these numbers into the respective boxes).
Click on Show to see what effect these changes have. In this case the chart looks like:-
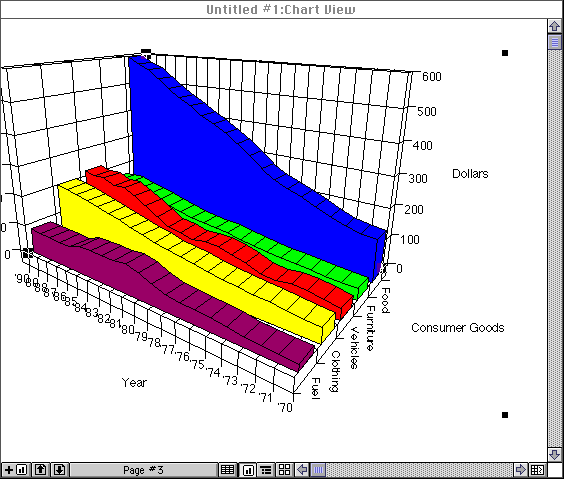
Try experimenting with the elevation, rotation, and perspective values to see the effects of different value sets.
Changing Fill Patterns and other Attributes
You can select and change a chart element, the top, side, or end of the data area graphics or chart plane, or an individual square within the top of the area data graphic. It all depends on what you have selected.
When an element is selected, you can use palettes from the toolbox ...

... to change fill patterns, line patterns, line widths, and colours on your chart. (Hold the <Control> key down while clicking once on the entire chart or on a single selected element to display an attribute dialog where you can change multiple attributes at the same time).
For example, click on the area data graphic furthest away from you (i.e. the high blue one at the back). Then choose the palest magenta shade from the Fill Forecolor palette on the Deltagraph toolbox. (Note if the toolbox is not visible, select Show Toolbox from the Draw menu). The graph becomes:-
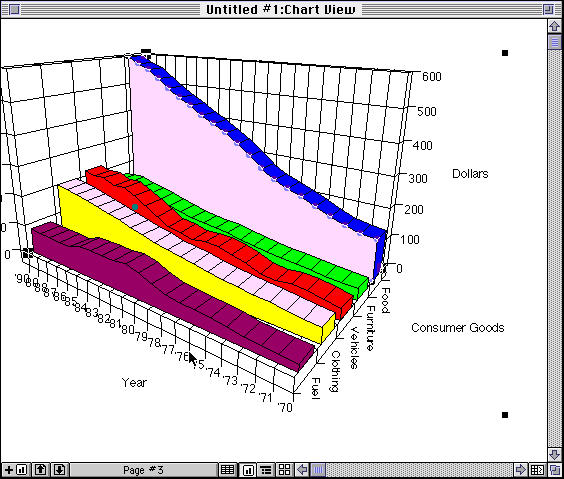
Try experimenting by selecting other chart elements and varying choices from the toolbox’s fill and line patterns, line widths and colours.
Graphics Multimedia Virtual Environments Visualisation Contents