Creating a Line Graph
A line chart can be used to show the trend of one or more items over a period of time or number of events. Line charts are best for plotting a long series of data points.
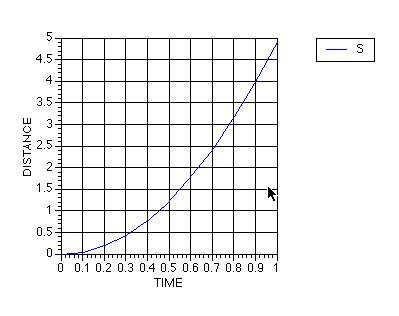
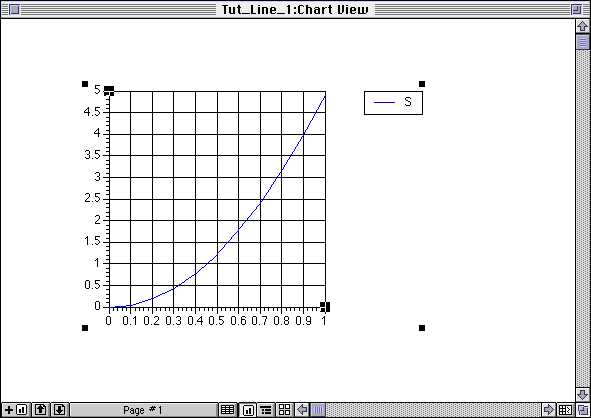
Let’s start by looking at the sort of graph we’re aiming to produce. The following line graph shows the distance S metres travelled in a time t seconds by an object free-falling from rest under gravity:

The graph is based upon the following data:
| t | 0.000 | 0.100 | 0.200 | 0.300 | 0.400 | 0.500 | 0.600 | 0.700 | 0.800 | 0.900 | 1.000 |
| S | 0.000 | 0.049 | 0.196 | 0.442 | 0.785 | 1.227 | 1.767 | 2.405 | 3.141 | 3.975 | 4.907 |
In order to construct the graph, we proceed via a number of simple steps, as follows:
Naming and Saving Deltagraph Files
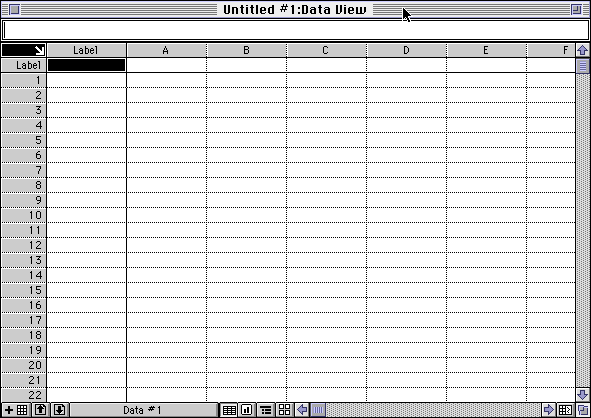
We start by naming and saving various files. Recall that the opening screen for Deltagraph is as follows:
Firstly, choose Save As ... from the File menu. A dialog box like that immediately below should appear:-
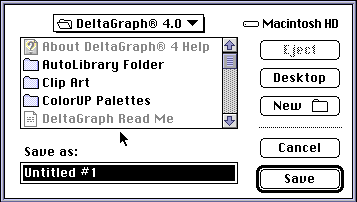
Choose the folder that you wish to store the Deltagraph file in, then click on Save:-
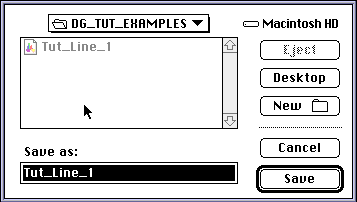
(Note: in this case, the file Tut_Line_1 is being saved in the Folder DG_TUT_EXAMPLES. If you want to save your Deltagraph file in some other folder, simply select it via the dialog box in the usual Macintosh manner).
The data page (the window within the Deltagraph screen formerly entitled Untitled#1:Data View) should now reappear with the name Tut_Line_1:Data View, as below:
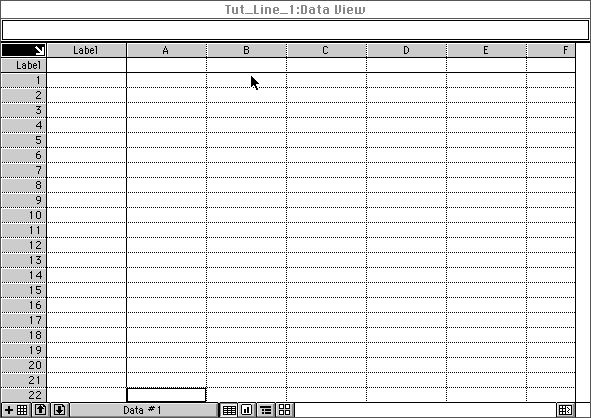
The Data Page
The data page is used to hold the data for the graph. The data page functions like a spreadsheet:
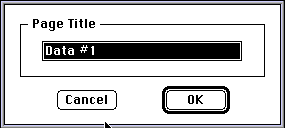
We firstly name the data page by selecting Name Page ... from the View menu. This results in the Page Title dialog box appearing:-
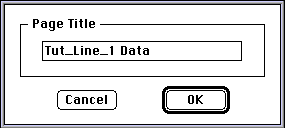
Type in Tut_Line_1 Data and click on OK:-
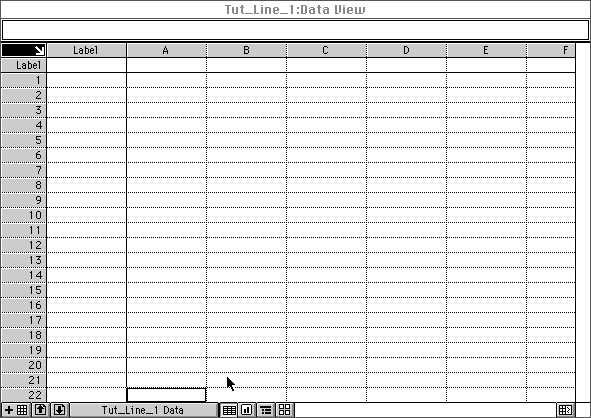
Notice that the new data page name is displayed in the new page selector icon near the bottom of the Deltagraph screen, as follows:
Entering the Data
We’re now ready to enter the data for the graph. Recall that the data is as follows:-
| t | 0.000 | 0.100 | 0.200 | 0.300 | 0.400 | 0.500 | 0.600 | 0.700 | 0.800 | 0.900 | 1.000 |
| S | 0.000 | 0.049 | 0.196 | 0.442 | 0.785 | 1.227 | 1.767 | 2.405 | 3.141 | 3.975 | 4.907 |
Simply type the data directly onto the data sheet, starting in column A row 1, in 2 columns exactly as in the table, thus:-

Notes
The Chart Gallery
Deltagraph provides a facility called the Chart Gallery which provides an example of each type of graph/chart that can be produced by Deltagraph. To display the chart gallery, choose Chart Gallery from the Data menu. The following window should appear:-
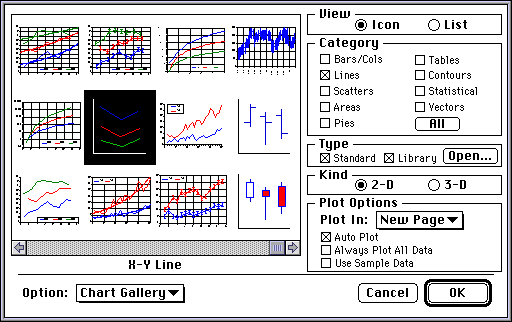
By selecting the Lines option in the Category box (and de-selecting all other categories), only those graph/chart types based on lines are displayed. (To see other categories, select the appropriate category, e.g. Bars/Cols, Scatters, Areas, Pies, Tables, ... and so on; to look at all possible graph/chart types, click on the All button in the Category box).
For our purposes, select the X-Y Line chart (highlighted in the above window), and then click on the OK button. The following window should be displayed:-
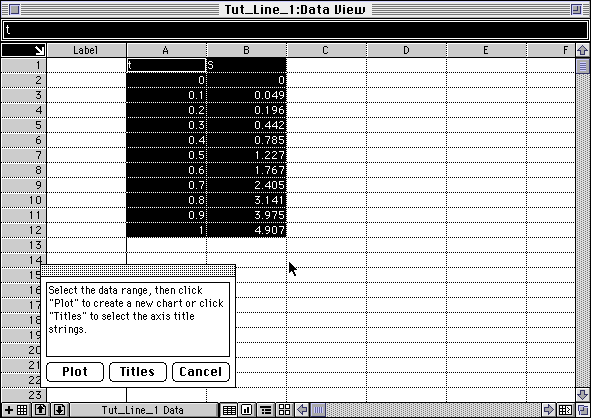
Making sure that you've selected the graph data by dragging across it (as in the above window), click on Plot in the floating window which sits on top of the Tut_Line_1 Data window. The following graph should appear:-

Notice that we have a legend (S) to identify the line graph. In order to label the axes, proceed as follows:-
Select the chart by clicking on it - control 'handles' (i.e. small black squares) should appear at each corner:-
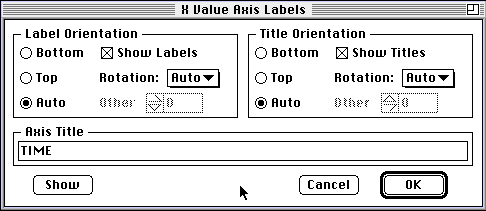
Select the Chart/Labels/Xaxis menu item. Type in TIME and click on the OK button. The label TIME should appear under the X-axis:-
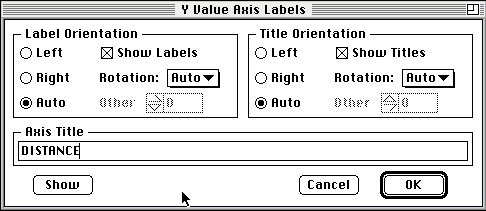
Select the Chart/Labels/Yaxis menu item. Type in DISTANCE and click on the OK button. The label DISTANCE should appear to the left of the Y-axis (rotated through -90 degrees).
The final graph should look like:-

... which is the graph we started out to achieve at the start of this section.
We shall use this graph in the sections immediately following this one concerning customisation of the line graph, so save the graph now (select Save from the File menu).
Graphics Multimedia Virtual Environments Visualisation Contents