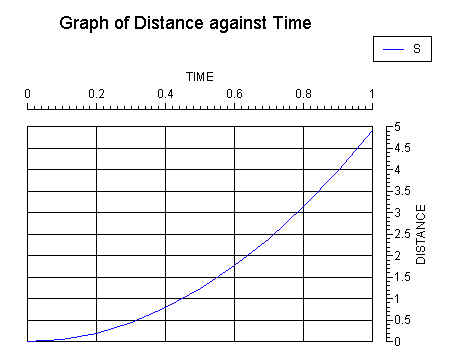
Before embarking on this section, ensure that the graph Tut_Line_1 (which was saved in the previous section) is currently opened within Deltagraph, i.e. you should be in Chart View looking at a Deltagraph window containing the following:-
Removing/Adding Grids: X-Axis
If it's not already selected, select the chart by clicking on it, then select Ticks & Grids then X Axis from the Chart menu. The following dialog box should appear:-
To remove the Major grid lines, click on the Major check box to de-select it. Then click on OK. The graph should now look like:-
Removing/Adding Grids: Y-Axis
Select Ticks & Grids then Y Axis from the Chart menu. The Y Value Axis Ticks & Grids dialog box should appear:-
This is essentially identical to that for the X-Axis. De-select the Major grid line option and click on OK. The graph will be redrawn without grid lines, thus:-
Tick Mark Placement and Tick Mark Length
Notice that the the X and Y Value Axis Ticks & Grids dialog boxes also allow for the placement of tick marks, and the setting of tick mark length. The options for tick mark placement are displayed by clicking on the down-arrow in the Major or Minor tick marks box within the Tick Mark Placement section. For example, for the Major tick marks the following options are revealed:-
If the down-arrow on the Major Tick Marks box in the Tick Mark Placement section is clicked, the following options are displayed:-
These options represent, from top to bottom:-
An identical set of options applies to the Minor tick marks for both X and Y axes.
Note also that it is possible to set the lengths of the Major and Minor tick marks by clicking on the up and down arrows associated with the Major Ticks and Minor Ticks boxes in the Tick Mark Length section.
Exercise
Try the following exercise to confirm your understanding of this section:-
X-Axis
The X Value Axis Ticks & Grids dialog box should look like:-
Y-Axis
Now repeat the above using the Y Value Axis Ticks & Grids dialog box and the graph should be redrawn as follows:-
Finally, save the graph (select Save from the File menu) for use in the next section.
Graphics Multimedia Virtual Environments Visualisation Contents