In order to display multiple line graphs on a single X-Y Line chart, simply enter the data for each individual line graph in adjacent columns of the data page. The first column contains the 'X' coordinates; subsequent columns contain the 'Y' coordinates. The line graphs are then drawn on the basis that each shares the same 'X' coordinates (the first column), and the 'Y' coordinates (held in subsequent adjacent columns) are then plotted against the same set of 'X' coordinates.For example, suppose that we have the following data page:-
i.e. we have the data used thus far to produce the line graph Tut_Line_1. In the first column (column A) we have the 'X' coordinates (in this case, the values 0, 0.1, 0.2, ... , 1 representing time (t)); in the second column (column B) we have the 'Y' coordinates (in this case, the values 0, 0.049, 0.196, ... , 4.907 representing distance (S)).
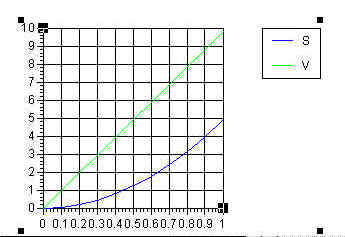
In order to draw a second line graph using the same 'X' coordinates, we simply put the 'Y' coordinates of the second line graph in (in this case) column C. Thus, if we wished to draw the line graph representing the velocity (V) of the free falling body at each of the t values, then we add the following data to column C:-
| V | 0.000 | 0.981 | 1.962 | 2.943 | 3.924 | 4.905 | 5.886 | 6.867 | 7.848 | 8.829 | 9.810 |
If we now:-
Choose Select All from the Edit menu; and then
X-Y Line from the Chart Gallery subitem of the Data menu; and finally
Click on OK
Then the X-Y Line chart will be drawn as follows:-
If you wish to draw further line graphs on the same X-Y Line chart, simply add the necessary 'Y' coordinate data in columns D, E, F, ... and so on.
________________________________________
Graphics Multimedia Virtual Environments Visualisation Contents