
Curve Fitting
In general, curve fitting refers to the mathematical processes and techniques involved in trying to find the curve which best "fits" a particular set of data points. This section of the tutorial assumes that you are familiar with the various approaches and simply wish to find out how to perform curve fitting in Deltagraph. If you are not familiar with curve fitting, and wish to learn more, then Chapter 13 of the Deltagraph User’s Guide Version 4.0 provides an introduction.
Restriction on Graph/Chart Types
Curve fits can only be performed on the following chart types:-
Fitting a Curve
Firstly, open the Deltagraph file .../Dg4/Samples/Curvfits/Cfxample.dg4, where Dg4 is the folder holding the Deltagraph software, by selecting Open from the File menu, and then navigating to the Curvfits folder, as follows:-
... and then click on Open. The following data view should appear:-
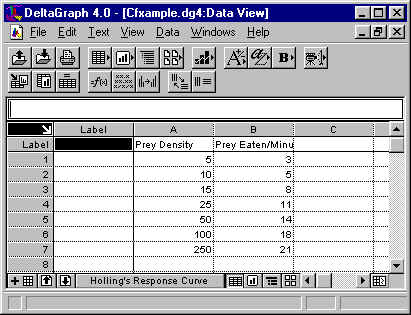
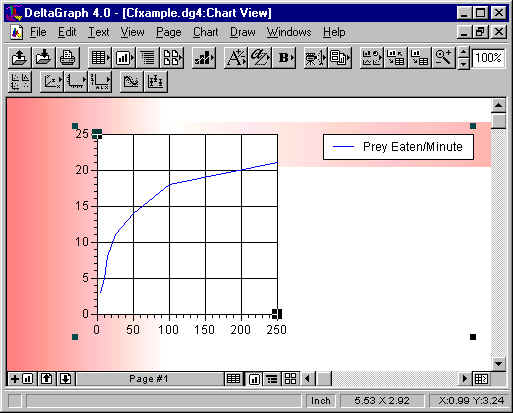
Select the data in the data view, then select X-Y Line from the Chart Gallery (in the Data menu); the following graph should be drawn:-
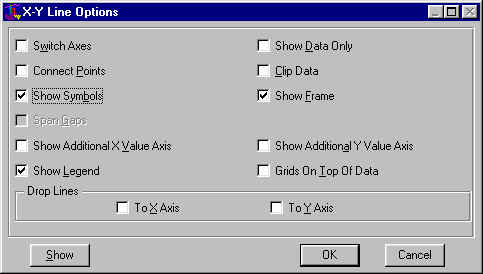
Now, select Options from the Chart menu. In the X-Y Line Options dialog box which appears, de-select the Connect Points option, and select the Show Symbols option, thus:-
... and click on OK. The graph should be redrawn as follows:-
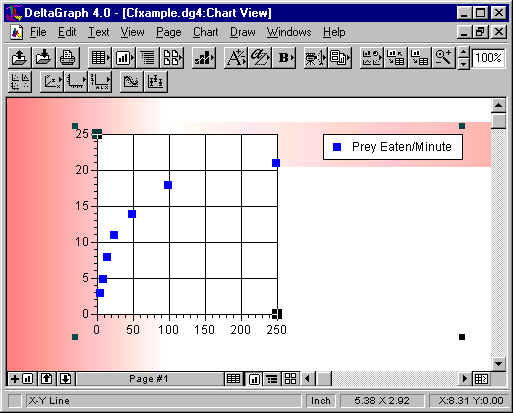
i.e. with no lines connecting the data points and with a square blue symbol at each data point.
Now, select Curve Fitting from the Chart menu. The following dialog box should appear:-
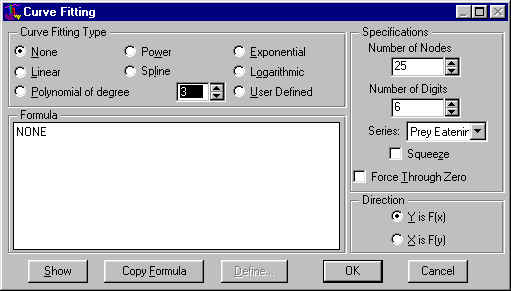
Now, select the series you wish to fit a curve to by pressing on the Series pop-up menu in the Specifications section. (In this example, only the 'Prey Eaten ...' series is available).
Next, choose the type of curve you want from the Curve Fitting Type section. For the purposes of this example, choose Spline, thus:-
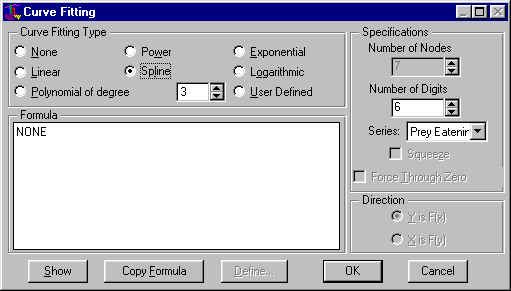
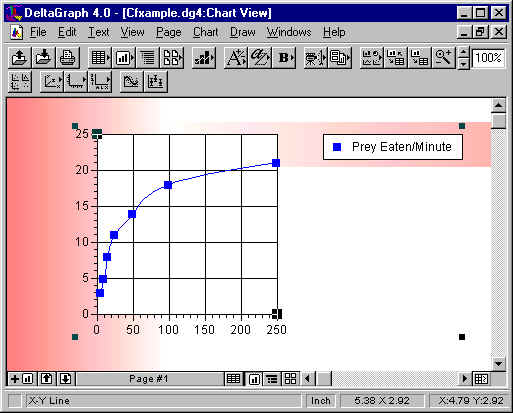
Now click on OK and the graph will be redrawn as follows:-
Try experimenting with the other options.
Notice that, for certain options, the Formula box contains additional information. This relates to mathematical information relating to the particular curve fitting option selected. This information can be copied (using the Copy Formula button) and pasted into a text block in your Deltagraph chart page. (Note that the Number of Digits field defines the number of digits that appear to the right of the decimal point in the mantissa of each of the parameters that appear in the curve fit formula displayed in the Formula window. Default is 6; range is 1 to 16; 0 means display all digits beyond the decimal).
The Number of Nodes field can be set (for appropriate curve types only - it is automatically dimmed and unalterable if not appropriate) between 2 and 250 (inclusive). Generally, more nodes means a more accurate representation of the curve. However, more than 2 nodes on a straight line is unnecessary, while a large number of nodes can use excessive memory.
When the Squeeze option is off, the curve fit is drawn over the entire axis of the domain of the curve fit function; when it’s on, the curve is restricted to an interval bounded by the smallest and largest domain values.
The Direction section allows you to choose Y (option Y is F(x)) or X (option X is F(y)) as the dependent variable.
The Force Through Zero option provides a convenient means of starting a curve fit at the origin. It applies only to linear and polynomial curve fits. If you want to force a curve fit through some Y intercept, you can do so by creating a user-defined curve fit.
User-Defined Curve Fitting
Deltagraph allows you to define your own curve-fit function. The discussion of this capability is outwith the scope of this tutorial. Interested readers are referred to Chapter 13 of the Deltagraph User’s Guide Version 4.0 for further information.
Graphics Multimedia Virtual Environments Visualisation Contents