 |
||||
| Also available as an Acrobat File | 

|
|
Contents
Main Report RecentDevelopments Examples Teaching Conclusion Weblinks Bibliographic History |
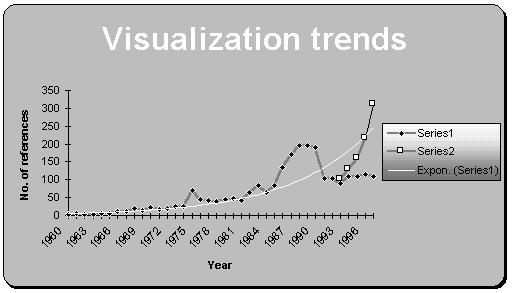
Review of Visualization in the Social Sciences: BibliographyVisualization: A bibliographic history Series 1 shows the estimated number of visualization-relevant conference papers, journal articles, books and chapters published between 1960-1997. An exponential trend line has been fitted to this data. Estimates from 1960-1990 are based on Dorling, DFL (1991) `The visualization of spatial social structures', Unpublished PhD thesis, University of Newcastle. Other estimates are based on the following bibliography. Series 2 includes Internet references. By 1997 an estimated 50 websites included visualization-relevant pages and links to further sites. Assuming three `articles' per site yields 150 articles for 1997. If the number of Internet articles is proportional to the growth in the number of Internet hosts then Series 2 may be estimated from the Network Wizards Internet Domain Survey, July, 1997 (http://www.nw.com/zone/WWW.report.htm)
|
Graphics Multimedia Virtual Environments Visualisation Contents