|
||||
| Also available as an Acrobat File | 

|
|
|
Visualisation in the Social Sciences WorkshopShow and TellPhilip Atkinson | |
Visualising the distribution of infectious diseases: an example using density estimation to examine the pattern of hepatitis AThe ProblemEpidemiologists are trained to ask three questions; who, what and where (Last 1988). The where question can reveal unusual clusters, helps to evaluate locality based interventions, and often forms the basis of risk associated hypotheses. The value of this geographical analysis has been clearly demonstrated in the work of Snow (1855), De Kruif (1926), and Burkitt (1970).The Royal Mail Address Manager (Post Office 1985) provides a 100m Ordnance Survey grid reference for each postcode in England and Wales (Raper et al. 1992), and allows epidemiologists to geo-reference disease cases in a quick and simple manner. By placing a symbol at the location of diseased individual, the spatial distribution can be examined. Unfortunately there are problems associated with the visualisation of individual based symbol distributions. Firstly, each postcode uses one grid reference to describe the spatial location of a group of households. Each case in the group of households will have the same location, appearing as just one map symbol. The reader cannot determine if one symbol describes one case or multiple cases. Secondly, the distance between symbols in high disease incidence areas can be so small to make them appear as one. It becomes extremely difficult to visualise the degree of disease intensity in areas of high infection. These visualisation problems are common to all individual based symbol distributions. This paper is concerned with infectious diseases, in particular hepatitis A. Infectious diseases by their very nature have a tendency to cluster, making the problems of multiple representation and high symbol density particularly troublesome. The SolutionOne solution to these problems are the techniques of density estimation (Silverman 1986, Bithell 1990, Diggle 1990, Brunsdon 1991). These attempt to measure the density of a point distribution at a series of sample points across the area of interest. These sample points are located so that they describe a two dimensional density surface representing spatial variation in the intensity of the spatial process that is assumed to operate. Surface "height" will vary with local disease incidence even if cases are located at the same geographical point. Visualisation of the density surface thus provides good indicators of the overall variation in true disease density and detail in areas of high density.
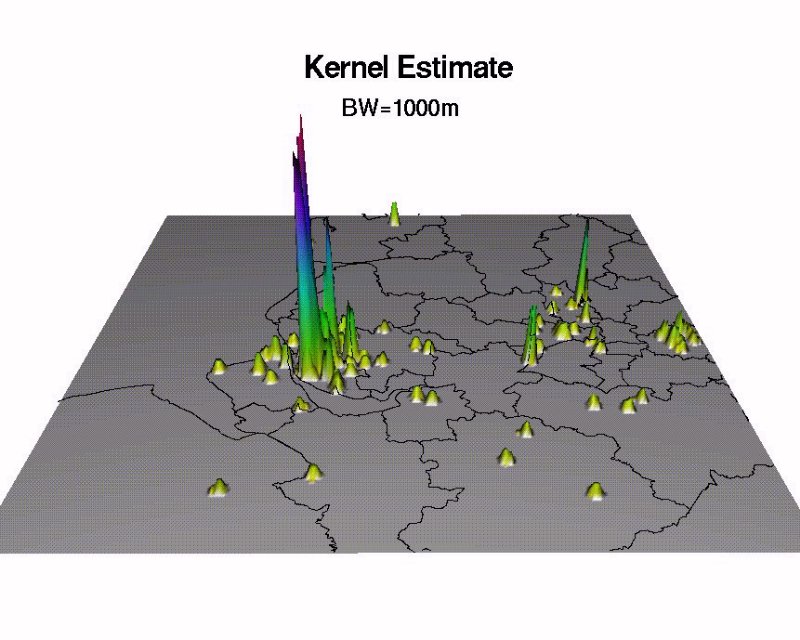
The density surface can be viewed in either 2 or 3 dimensions. In two dimensions, either choropleth shading, contouring or bubble plots can be used. This approach fits current convention in health service mapping, and allows recognisable features to be easily drawn on top of the surface to assist the reader locate the map in real space. While two dimensional visualisation may be sufficient for the majority of density surfaces, infectious disease surfaces cause a particular problem. The clusters inherent in infectious disease surfaces lead to extremely "spikey" surfaces, with large density variations over small geographical areas. Using two dimensional visualisation methods it is difficult to determine the degree of variation in places with high disease incidence; places of particular interest to epidemiologists. The graphic associated with this paper shows the distribution of hepatitis A in NW England based on data from the National hepatitis A case-control study in 1990-91 (Atkinson and Unwin 1997). The spikey distribution of the density surface meant that 2D visualisation proved inadequate. Three dimensions allows the reader to determine variations in density in high incidence areas, for example within the city of Liverpool, and encourages further exploratory data analysis as the surface can be rotated and viewed from many different angles. The toolsThe different density estimation programs were written in the MapInfo programming language MapBasic. The results were exported to the public domain GIS package GRASS with the Silican Graphics SG3D extension for visualisation and exploratory data analysis.ReferencesAtkinson P., Unwin D. The use of density estimation techniques in mapping the distribution of hepatitis A. Proceedings of the International Workshop on Geomedical Systems, Rostock, Germany, September 1997.Bithell, J.F. (1990) 'An application of density estimation to geographical epidemiology', Statistics in Medicine, 9, 691-701. Brunsden, C. (1991) 'Estimating Probability surfaces in GIS: An adaptive technique' in Harts, J., Ottens, H.F.L., and Scholten, H.J. (eds) Proceedings First European Conference on Geographical Information Systems, Amsterdam, EGIS Foundation: Netherlands, 155-64. Burkitt DP, Wright HD (1970). Burkitt's Lymphoma. Edinburgh, Livingstone Press. De Kruif P (1926) in (Bruce) Trail of the Tsetse 246-70 Microbe Hunters, San Diego, Harvest Books. Diggle, P. (1990) 'A point process modelling approach to raised incidence of a rare phenomenon in the vicinity of a prespecified point', Journal of the Royal Statistical Society, 153, Part 3, 349-362. Last JM (ed). (1988). A Dictionary of Epidemiology. Oxford, International Epidemiological Association, Post Office (1985) 'The postcode address file digest', The Post Office, London Raper, J., Rhind, D.W., and Shepherd, J. (1992) 'Postcodes: The New Geography', Longman, London. Silverman, B.W. (1986) Density Estimation, Chapman and Hall: London. Snow JM (1855) On the mode of communication of cholera (2nd ed). London, Churchill Livingstone Contact DetailsPhilip AtkinsonEmail: Phil@cdscthames.co.uk Public Health Laboratory Service Communicable Disease Surveillance Centre |
||
Graphics Multimedia Virtual Environments Visualisation Contents