
|
||||
| Also available as an Acrobat File | 

|
|
|
Visualisation in the Social Sciences WorkshopShow and TellProfessor A. Stewart Fotheringham, Mr. Martin Charlton and Dr. Chris Brunsdon | |
Two suggested topics to be presented at the Advanced Visualisation and Virtual Reality in the Social Sciences Conference
Topic 1: A 'Spatial Microscope' using GWR(graphic will be prepared for the conference)Geographically Weighted Regression (GWR) is a statistical technique developed by the authors to allow spatial variations in relationships to be mapped as surfaces. Ordinary regression using spatial data allows the estimation of one set of parameter estimates with each estimate being an average value representing an assumed uniform relationship over space. This is the starting point of the spatial microscope because the surface represented by this parameter estimate is a flat plain with no features. It is akin to looking down a microscope which is completely out-of-focus and no detail can be seen on any spatial differentiation of the surface. GWR proceeds by estimating regression relationships 'around' each point on the surface so that n parameter estimates are obtained for any relationship where n is the number of points defined at which the regression is undertaken. The flexibility of GWR, and the utility for the graphical display proposed here, is that the definition of 'around' can be altered to show increasing amounts of detail. If very broad spatial kernels are selected around each point, the surface of parameter estimates that results has relatively little detail on it. As the kernel becomes smaller around each point, equivalent to focusing the microscope, increasing amounts of detail on the spatial non-stationarity of the parameter surface becomes obvious. Our graphic will demonstrate the spatial microscope using primary school performance data for 3,687 schools in Northern England. We will examine the determinants of school performance in terms of various socio-economic factors of school catchment areas. The spatial microscope will operate with a slider bar indicate the size of the spatial kernel and the resulting amount of detail on the surface. We will demonstrate the increasing amounts of detail present in the spatial parameter surface as the microscope is 'focused'. Topic 2: A demonstration of parallel co-ordinates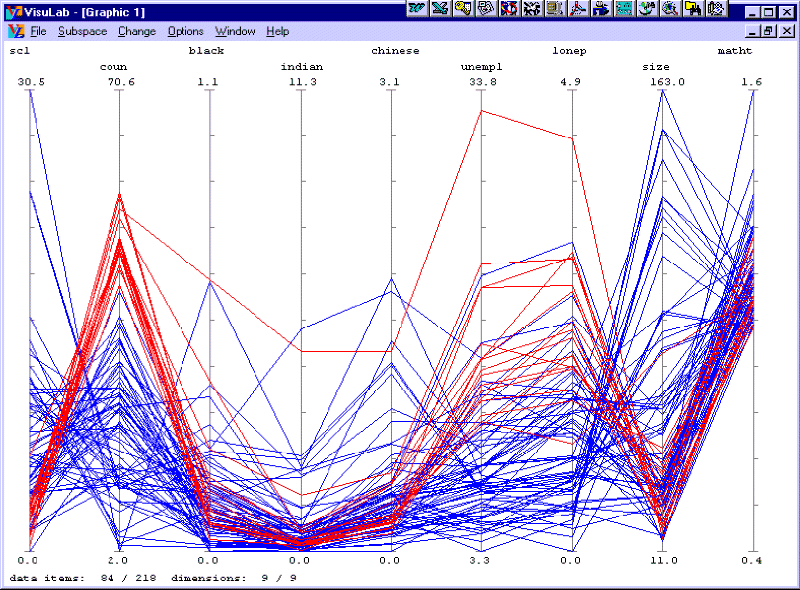 An alternative exploration of the school performance data described above is provided by the display of the data on parallel co-ordinates. The attached graphic demonstrates the relationship between school performance for 84 highly performing schools and eight possible explanatory variables. The graphic will be described and demonstrations of how aspects of the data can be selected and highlighted to tease out relationships. The display will be done interactively to demonstrate the full capabilities (and the problems) with this visualisation technique. Further details of parallel co-ordinate displays are presented in the Visualisation report from Fotheringham, Charlton and Brunsdon as part of the previous AGOCG funding round and which is being discussed by Professors Unwin and Fisher at this conference. Contact DetailsStewart Fotheringham,Email: Stewart.Fotheringham@ncl.ac.uk Department of Geography Daysh Building University of Newcastle Newcastle NE1 7RU Telephone : 0191-222-6434 Fax : 0191-222-5421 |
||
Graphics Multimedia Virtual Environments Visualisation Contents