 |
||||
| Also available as an Acrobat File | 

|
|
|
Visualisation in the Social Sciences WorkshopShow and TellBrendan Halpin | |
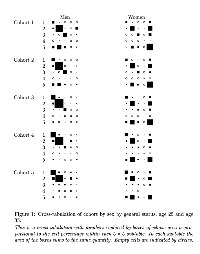
 This graphic is an attempt to present tabular data so that its structure is rapidly apparent. The key idea is to represent the cells as squares whose area is proportional to their value. In this case a four dimensional table -- before and after on a 5-category variable, by sex and cohort (5 categories) -- is presented. The main structure of interest is the before--after relationship and how it is affected by cohort and sex, so the area of the squares sums to 100% within each 5 by 5 panel. It is immediately apparent that there is a very strong before--after association, and that it differs strongly across the sexes and less radically across the cohorts. Squares are chosen, rather than e.g. vertical bars, because of the range of the cell values: with 1-dimensional bars the smaller values would all be near invisible. This was done with Emacs and LaTeX. The postscript file was submitted. |
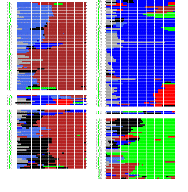
 This represents a clustering of sequence data, where the sequences represent individuals moving through an 8-state space over 80 time-units. The sequences have been clustered using optimal matching analysis, and this representation allows us to examine the contents of the clusters visually. Each block represents a main cluster, and within the blocks each line represents an individual's career, each of the 8 states having its own colour. This page is a subset of the approximately 1000 sequences which were clustered. We can readily see the intra-cluster similarities, and the presence of distinct subclusters. The optimal matching and clustering software is PileUp, part of a molecular biology package, but similar things can be done with TDA and standard clustering software. The colorisation was achieved with Emacs, though probably most wordprocessors could be made to do it too. This is attached as a colour PostScript file. |
|
Contact DetailsBrendan HalpinE-mail: brendan@essex.ac.uk ESRC Research Centre on Micro-Social Change University of Essex, Colchester CO4 3SQ, UK Work: +44-1206-873790 http://www.irc.essex.ac.uk/~brendan |
||
Graphics Multimedia Virtual Environments Visualisation Contents