 |
||||
| Also available as an Acrobat File | 

|
|
|
Visualisation in the Social Sciences WorkshopShow and TellDiego Jiménez and Dave Chapman | |
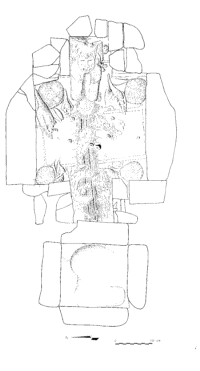
Visualizing 3D spatial patterns of archaeological assemblagesAbstractRecognising spatial patterns between artifacts is one of the major challenges in archaeological research. The task includes both the identification of meaningful spatial relationships and a clear visualisation of such connections. The traditional approach to the problem involves the application of nearest neighbour analysis or other statistical techniques for defining clusters, as well as the production of dendograms for displaying results. However, such procedure has not always been totally successful for isolating meaningful relationships.In this paper we will present a new alternative solution. Firstly, we extract three dimensional spatial relationships between artifacts using the so called Proximity Graphs (Gabriel Graph, Relative Neighbourhood Graph, Beta-Skeleton, etc.). Secondly, we implement generic tools to visualise the patterns interactively using IRIS Explorer. Proximity graphs were developed in Computational Geometry to solve connectivity-related problems. They allow the identification of links between objects through the analysis of their topology at different levels of resolution. Therefore, they are useful for analysing the characteristic "shape" or structure of a set of points. Since the analysis is based on points, and points can represent many different things, the solution offered in this paper has many applications in other scientific fields. As study case we have chosen a group of 120 archaeological offerings from the Templo Mayor of Tenochtitlan (Mexico). Mexica offerings have been described as collections of artefacts whose topology is highly relevant to descipher their meaning. It has been said that the semantic value of every artefact depends not only on the symbolism of the object itself but also on its position and connections to other objects. In contexts like this, the identification and especially the visualisation of all possible meaningful relationships become a critic condition for a successful interpretation. 

About the authorsDiego Jiménez is a PhD student in the Department of Geomatic Engineering, University College London. He also works a a researcher in México for the National Institute of Anthropology and History (INAH).Dave Chapman is Senior Lecturer in the Department of Geomatic Engineering, University College London. Contact DetailsDiego Jiménez Dave Chapman |
||
Graphics Multimedia Virtual Environments Visualisation Contents