
|
||||
| Also available as an Acrobat File | 

|
|
Contents
Main Report RecentDevelopments Examples Conclusion Weblinks |
Review of Visualization in the Social SciencesGeographyOf all the social science disciplines, geography would appear to make the greatest use of visualization. This can be attributed to two main factors. First, geography is closely affiliated with science, through links with physical geography and the earth sciences. This link has facilitated the flow of computer technology across the discipline in terms of both hardware and expertise. Secondly, geography is relatively unique amongst the social sciences with its almost exclusive use of spatial data, reflected in its cartographic origins. By definition, these data have an extra dimension inherent in their structure, and it has been the necessity to visualise this extra dimension that has driven geographers to adopt and develop new visualization technologies. Hence geography has had a long association with visualization and, due to its interdisciplinary nature, it can be argued that this represents the dominant trend in visualization research and development within the social sciences. Consequently, geographic visualization methods tend to be more generally appreciated within the social sciences, and as a result, will not be dwelt upon in great detail in this review.The principal area of development of visualization tools and technologies has been within the domain of GIS, specifically integrating GIS with different software packages and environments. Traditional uses of GIS in this field have been to visualise the spatial aspect of the data, particularly with respect to error visualization (e.g. Cockings et al. 1997), and spatial associations (e.g. Anselin et al., 1996). When integrated with advanced visualization tools however, GIS can become very effective in the analysis and presentation of complex data in a wide range of disciplines such as planning and resource management (e.g. Conners, 1996; Bishop & Karadaglis, 1997; Davis & Keller, 1997). Increasingly, these integration strategies have been `tight', using software packages written in the C programming language to build directly within the GIS. For instance, SimLand (Wu, 1998) is a prototype model to simulate land use conversion based on cellular automata (CA) and multi-criteria evaluation (MCE) modules, written in C and tightly integrated with ARC/INFO GIS. It uses a graphical user interface (GUI) that allows the model to be driven by menus and automates the simulation of land conversion in the urban-rural fringe. This has several advantages, such as allowing the visualization of the decision-making process and permitting easier access to spatial information. Another recent example of integrating GIS with modelling software is the Clarke et al (1997) simulation of urban growth in San Francisco. 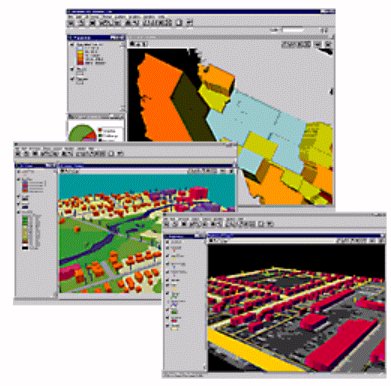 Figure 2 An important area of visualization in GIS is the integration of 3D visualization technology. Standard elements of GIS can imply 3D representation, but new techniques in multimedia, 3D modelling and VR are now at the point where they might be embodied in GIS (Faust, 1995). Faust argues that a true 3D GIS must enable the following functions:- a realistic representation of the third dimension in the data and in visualization, free movement of the user within the three dimensional representation, normal GIS functions, such as query and overlay, but within 3D data space, and visibility functions such as line of sight estimation. Currently, the Environmental Systems Research Institute (ESRI) is developing the 3D Analyst extension for ArcView, that will enables users to create, analyse and display surface data (Figure 2). However, the principal research into visualising and analysing 3D spatial data in a GIS has been with respect to VR techniques on the Web. These are discussed in detail in the planning section. Parallel to these visualization developments in GIS has been a radical transformation within cartography (Grelot, 1994; Kraak et al, 1995; Krygier, 1995). Consequently, a significant amount of `cutting edge' GIS visualization research and development on the Web is actually computerised cartography, recently re-labelled as scientific visualization. Scientific visualization is a growing area of computing with the underlying philosophy that displaying visual representations of data assists researchers in generating ideas and hypotheses about the data (Fisher et al., 1993). Accordingly, Dykes (1996) suggests that cartographic visualization systems may represent the principal technology for the scientific visualization of digital spatial information. He argues that many statistical and GIS software programmes do not regard the map as a real-time tool for analysing data, or as an interface to access the underlying information. Cartographic visualization systems, however, can provide intelligent assistance to GIS users by allowing data mining and/or exploratory data analysis. This is examined in more detail in social statistics section of the report. Compared to merely automating previous mechanical and manual technologies, more dramatic changes in visualization in cartography have been due to developments in computer graphics. For instance, cartograms (Dorling, 1995) are increasingly being recognised as a major solution to many spatial visualization problems of human societies. The gross misrepresentation of many groups of people on conventional topographic maps has long been seen as a major problem of thematic cartography, highlighting difficulties such as the modifiable areal unit problem. Cartograms are now being used in the visualization of high-resolution spatial social structures and in the mapping of long-run historic changes in society [8]. The importance of GIS and cartographic visualization on the Web is exemplified by The Cartographic Project [14]. This is a three year special project started last year (1997) which has been commissioned by the Association of Computing Machinery (ACM) Special Interest Group on Computer Graphics (SIGGRAPH)[1] in collaboration with the International Cartographic Associations (ICA) Commission on Visualization. The project is studying how viewpoints and techniques from the computer graphics community can be effectively applied to cartographic and spatial data sets, and enhance the development of their visualization research. Part of the project includes a survey investigating the use of cartographic and geographic visualization on the Web between January and February 1997, providing a snapshot of recent computer graphic and Web tool usage. The profile that emerged from the survey was that of a population engaged in a wide and varied assortment of computer graphics and cartographic research. The tools and data types that respondents used were as diverse as the projects in which they were engaged, with use of the Web being widespread, particularly for data distribution and information sharing. Although many respondents were investigating the implications and potential uses of VR, few had incorporated it into their projects in any way. It must be pointed out, however, that the majority of respondents and researchers came from a science background, such as physical geography and remote sensing. Social science research was to be lacking in the survey. |
Graphics Multimedia Virtual Environments Visualisation Contents